The science behind the Home Baseline
What we measure, and why it matters.
Your home sets the air you breathe for much of the day, the light and sound you sleep in, and the water you drink. In an EPA-sponsored national study of 9,386 Americans (1992 to 1994), people reported spending about 87% of their time inside buildings of all kinds, from homes to workplaces and stores. The data are more than 30 years old, but a 2024 National Academies report still describes Americans as spending the vast majority of their lives indoors. The Home Baseline measures five things in your rooms for about a week (carbon dioxide, fine particles, temperature and humidity, light, and nighttime sound), and your tap water goes to an independent laboratory.
For each one, you will find what research says about why it matters for sleep, focus or the home, the studies behind it with a link to each, the published benchmark your report compares it with, and where our instruments stop. Where a study found a link rather than a cause, we say so. We describe what research found, and we never promise that a test or a fix will change anyone's health.
Bedroom air
How much fresh air reaches your bedroom at night.
You spend a whole night in your bedroom, often with the door closed. Indoors, most carbon dioxide comes from people breathing out, so it builds up when a room gets too little outdoor air for the number of people in it. That makes carbon dioxide, measured in parts per million (ppm), a useful sign of how much fresh air reaches you while you sleep. In several studies, bedrooms with less ventilation have been linked to small differences in sleep, such as slightly less efficient sleep and more time awake. Outdoor air is about 430 ppm (NOAA, 2026), and city air can run higher for short periods, so the most useful number is how far a room climbs above the outdoor air around it.
32%
of 500 Danish children's bedrooms averaged under 1,000 ppm of carbon dioxide over the nights measured.
Bekö et al., Building and Environment, 2010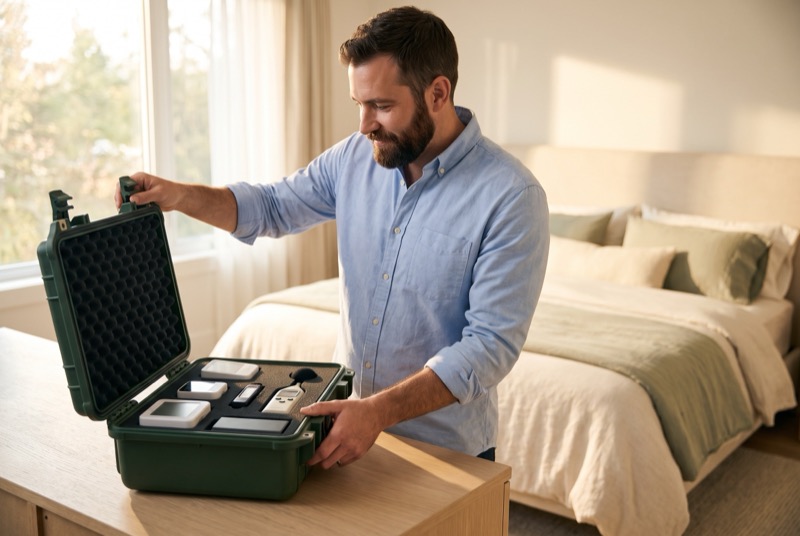
What the research shows
In a controlled study, 36 young, healthy adults slept alone in simulated bedrooms for two nights at each of three ventilation settings. Compared with settings that kept carbon dioxide near 750 ppm, settings that let it average 1,000 or 1,300 ppm lowered sleep efficiency by 1.3% and 1.8% and added 5.0 and 7.8 minutes awake, measured with a wrist tracker. Because less ventilation also raises body odors and other indoor pollutants, the study cannot pin the change on carbon dioxide alone.
Kang et al., Building and Environment, 2024In a single-blind study in 29 real bedrooms, researchers switched each home's exhaust fan between low, moderate and high speed for a week at a time, without telling the sleepers when or whether it would change. In the 12 bedrooms where carbon dioxide clearly differed across all three settings, people had less deep sleep, more light sleep and more awakenings at the lower settings, measured with wrist trackers. Evening and morning thinking tests did not differ, and the authors call for larger studies.
Fan et al., Science of the Total Environment, 2023In single-occupancy student dorm rooms, 16 students spent one week with a quiet intake fan that ran whenever carbon dioxide passed 900 ppm and one week with it switched off (averages of 835 and 2,395 ppm). With the fan running, sleep quality measured by wrist movement, how fresh the air felt, next-day sleepiness, self-rated concentration and a logical-thinking test all improved. Because the fan brought in outdoor air, the study cannot separate carbon dioxide from the other substances stale air carries. It was a small, short study in students.
Strøm-Tejsen et al., Indoor Air, 2016
6 more studies
In the bedrooms of 500 Danish children aged 3 to 5 (200 with asthma or allergy symptoms, 300 chosen at random), logged for about 2.5 days each, only 32% averaged below 1,000 ppm over the measured nights. 23% had at least 20 minutes above 2,000 ppm, and 6% went above 3,000 ppm.
Bekö et al., Building and Environment, 2010In 20 bedrooms in Wellington, New Zealand, measured for two weeks each in 2023, the median overnight reading was 907 ppm, and night peaks topped 2,000 ppm in half of them.
Bennett et al., New Zealand Medical Journal, 2026In a blinded study in a lab office, 24 professional workers from the Syracuse, New York area spent six workdays under different air conditions. On days when pure carbon dioxide was added while fresh air stayed the same, scores on a decision-making test were 15% lower at about 945 ppm and 50% lower at about 1,400 ppm than on days near 550 ppm. This was one test in a daytime office, and other labs using different tests have not found effects from pure carbon dioxide at these levels. The study was funded by a corporate gift, and the paper states the funder had limited input on its design.
Allen et al., Environmental Health Perspectives, 2016In a year-long observational study of 302 office workers in six countries, each 315 ppm rise in carbon dioxide at their workstation was associated with a 0.85% slower response time on a color-word test and a 1.13% slower response time on an arithmetic test. Differences between people were far larger than these effects, and the design shows an association, not cause.
Cedeño Laurent et al. (Harvard COGfx study), Environmental Research Letters, 2021In a Swedish case-control study, 198 children with at least two of wheezing, rhinitis or eczema and 202 healthy children (390 homes) were examined by physicians, and home ventilation was measured with a tracer gas. Children with symptoms lived in homes with lower ventilation, and the authors reported signs of a dose-response pattern. This shows an association; it does not show that low ventilation caused the symptoms.
Bornehag et al., Indoor Air, 2005Scientists have not settled whether carbon dioxide itself, apart from the stale air it signals, affects sleep or thinking at everyday indoor levels. ASHRAE calls the evidence inconsistent: six lab studies reported thinking effects near 1,000 ppm, while others that added pure carbon dioxide found none. Either way, carbon dioxide is a useful sign of how much fresh air a room gets.
ASHRAE Position Document on Indoor Carbon Dioxide, 2025
The benchmark
Your report marks 1,000 ppm, a ventilation line that goes back to the 1800s, when Max von Pettenkofer proposed it as a sign of poor ventilation rather than a toxic threshold, with a stricter 700 ppm for bedrooms, as recounted by ASHRAE (2025). ASHRAE itself recommends no carbon dioxide limit. The authors of a 2024 sleep study (Kang et al.) conclude that bedroom ventilation producing an average of 1,000 ppm or more should be avoided.
What your case records
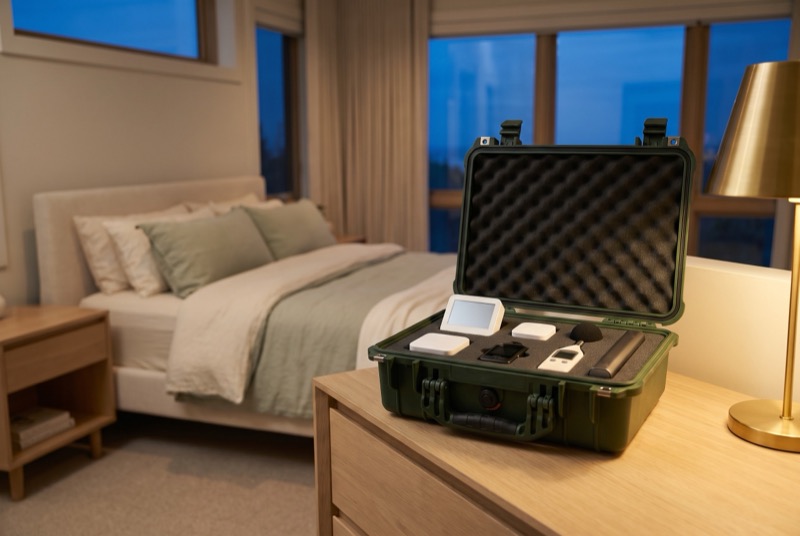
Every case holds an Aranet4 carbon dioxide meter with an NDIR sensor, logging every ten minutes for the whole week, with automatic calibration switched off. Because it records around the clock, your report shows each bedroom's overnight climb and its full-week average, and says which window each number covers.
What you can do
Every fix brings more outdoor air to each sleeper. The free one is a bedroom door or window left open when the weather permits: in one study of 17 young adults (Mishra et al., Indoor Air, 2018), an open window or door averaged 717 ppm against 1,150 ppm closed. An open window also lets in outdoor air, noise, heat and humidity, so it is a trade-off when the air outside is poor or the street is loud. Beyond that, bath and kitchen fans that vent outside help, and a mechanical fresh-air system such as a heat recovery ventilator is work for a licensed heating and cooling (HVAC) contractor. Air purifiers that remove particles do not lower carbon dioxide. A re-test shows whether the reading came down.
Where our instruments stop
Our meter measures one gas at one spot. Carbon dioxide is a useful sign of how much outdoor air reaches the people in a room, but it is not an overall measure of air quality: pollutants released by building materials or coming in from outdoors do not follow it. The meter cannot tell whether a change came from a door, a window, a fan or a different number of sleepers, and it cannot separate carbon dioxide from the other substances that build up with it. Its maker states an accuracy of plus or minus 30 ppm plus 3% of the reading, and results depend on calibration and placement.
Fine particles
What cooking, candles and outdoor air leave in your rooms.
Fine particles (PM2.5) are airborne particles 2.5 micrometers across or smaller. Indoors, they come from outdoor air that works its way inside and from everyday life: cooking, burning candles, a fireplace or an unvented heater, smoking. Because we spend so much time inside, the National Academies conclude that we breathe more outdoor particles indoors than outdoors, and their 2024 report found ample evidence that breathing fine particles indoors harms health. In homes without smoking or other strong particle sources, EPA expects indoor levels to be about the same as or lower than outdoor levels.
About half
of the fine particles indoors in a typical home traced to activity inside it, in a study of 3,977 US homes, mostly on the West Coast.
Lunderberg et al., PNAS, 2023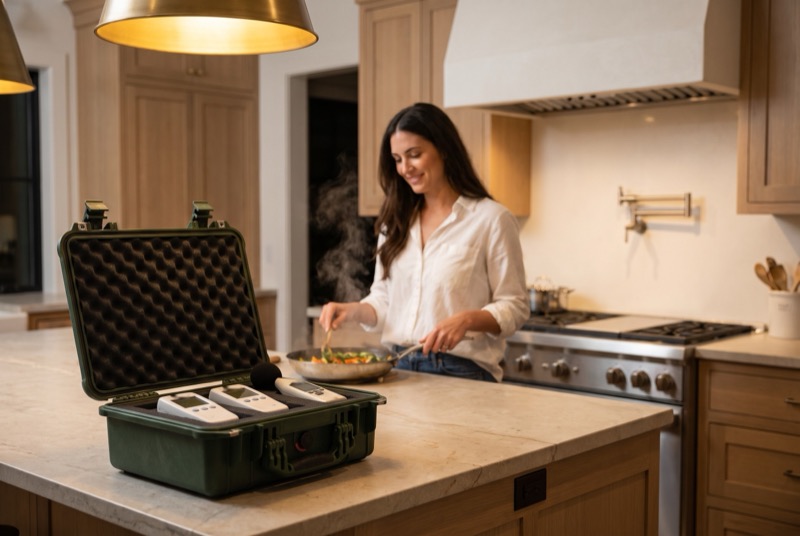
What the research shows
A 2024 National Academies expert report, requested by EPA, concluded that there is ample evidence that breathing fine particles indoors harms health. Effects on the lungs and breathing are clear, evidence for heart and blood vessel effects is growing, and evidence for other effects is emerging. Much of this knowledge comes from studies of outdoor particles, which also make up a large share of the particles indoors. Studies of indoor particles and short-term heart measures such as blood pressure have had mixed results. None of this means a single home reading will cause disease.
The National Academies, Health Risks of Indoor Exposure to Fine Particulate Matter, 2024In a study of 260 Boston children aged 6 to 12, mostly from lower-income neighborhoods, researchers measured PM2.5 in each family's main living area for one week. Children whose homes averaged 15.6 µg/m³ or more (the top fifth of the sample) had about 3.5 times the odds of sleep-disordered breathing compared with the other children, after accounting for family income, season, outdoor PM2.5, secondhand smoke and health factors. Particles and breathing were measured at the same point in time, so the study shows a link, not that the particles caused the breathing problems.
Wang et al., Sleep Health, 2025In a year-long study of 302 office workers in six countries, people did slightly worse on short phone-based thinking tests when indoor PM2.5 in their office was higher during the hour they took the test. For each 8.8 µg/m³ increase, response time on one test rose 0.8% and correct answers per minute on another fell 1.5%. In a further analysis, the link showed up mainly at or above 12 µg/m³. It was an observational study in offices, so it shows a link rather than a cause, and it did not test homes, sleep or long-term brain health. The study was funded by US government research grants and a gift from an HVAC maker.
Cedeño Laurent et al. (Harvard COGfx study), Environmental Research Letters, 2021
4 more studies
In a study of 3,977 US homes with indoor sensors, most of them in California, Washington and Oregon, researchers compared indoor readings with outdoor sensors within 5 km. In the typical home, about half of the indoor fine particles traced to outdoor air and about half to indoor activity. Homes varied a lot: the indoor share ranged from roughly one-sixth to three-quarters. Indoor spikes were most frequent at mealtimes and on Thanksgiving and Christmas, which points to cooking. On average, indoor levels were lower than outdoor levels, and that held in 92% of the homes.
Lunderberg et al., PNAS, 2023In a small pilot trial funded by an air purifier maker, 30 healthy UK adults each used a bedroom air purifier for 2 weeks with a real HEPA filter and 2 weeks with a placebo filter, without knowing which was which. With the real filter, people reported about 19 more minutes a night in bed. Their diary-reported sleep time was about 12 minutes longer, but that difference fell just short of statistical significance. Wrist-watch data showed more time awake during the night with the real filter, and most other sleep and mood measures did not change. Bedroom particle levels were already low in both conditions.
Lamport et al., Journal of Sleep Research, 2023Short trials of home air cleaners, mostly lasting days to a few weeks, have found small average drops in systolic blood pressure. A 2021 review of 14 trials found an average drop of about 2.3 mmHg and rated the overall certainty of this evidence as very low. These trials measured short-term markers such as blood pressure, not heart attacks, strokes or deaths.
Xia et al., Science of the Total Environment, 2021In lab tests of four home range hoods, the share of cooking particles a hood captured varied widely with the cooking setup and fan speed. Frying a hamburger at medium heat on a back burner, the hoods mostly captured more than 80%. Stir-frying green beans in a wok at high heat on a front burner, they captured only 3% to 11% of 0.3 to 2.0 µm particles on low fan settings and 16% to 70% on high settings. The dish, heat and burner all changed between the two tests.
Lunden, Delp and Singer, Indoor Air, 2015
The benchmark
The World Health Organization's 2021 guidelines recommend keeping PM2.5 at or below 5 µg/m³ as a yearly average, and at or below 15 µg/m³ as a 24-hour average on all but about 3 to 4 days a year. WHO states that its guidelines apply indoors as well as outdoors. The levels come mainly from long-term studies of outdoor air, and WHO notes that even its 5 µg/m³ starting point is not a level of zero risk.
What your case records
Every case holds an Atmotube PRO 2 particle sensor, taking a reading every fifteen minutes. Your report averages each calendar day on its own, counts the days each room went above WHO's 15 µg/m³, and shows the time of day each rise began, so you can match it to what was happening in the house at that hour.
What you can do
The National Academies group practical steps into four kinds: reduce particles at the source; ventilate, including range hoods and exhaust fans vented outdoors; filter the air with a central system or a room air cleaner; and use personal protection such as N95 masks during events like wildfire smoke. Run the range hood while you cook, on a higher setting when you can. EPA also advises venting fuel-burning appliances outdoors, having central heating serviced by a professional every year, and changing HVAC and air cleaner filters as directed. A licensed HVAC contractor can tell you what level of filtration your system can take. In one review of studies in homes, schools and offices, portable air cleaners lowered indoor PM2.5 by anywhere from 22.6% to 92.0% compared with no cleaner (Cheek et al., Science of the Total Environment, 2021). The National Academies found the evidence that this improves health to be inconsistent, and called the research on health benefits sparse and mixed.
Where our instruments stop
Our sensor reports particles 0.3 to 2.5 micrometers across, so like other light-scattering sensors it is expected to under-count the smallest particles, which cooking and gas flames can produce in large numbers, and it cannot tell what a particle is made of or where it came from. At typical indoor levels, two sensors of the same model can differ by up to 5 µg/m³ plus 5% of the reading, so a day just above or below 15 µg/m³ is within the sensor's stated precision. Readings every fifteen minutes can also blunt or miss short spikes: in a study of 18 California apartments, the typical indoor emission event lasted about 16 minutes (Chan et al., Indoor Air, 2018). One week can show which days went above 15 µg/m³, not whether a home meets WHO's yearly level.
Humidity and temperature
The warmth and moisture your rooms hold, day and night.
Bedroom temperature is tied to how well people sleep: in one Boston study of adults 65 and over, tracked in their own bedrooms for months, sleep was most efficient between 68 and 77 °F. Humidity shapes what lives in your home: dust mites pull their water from humid air, and mold grows where building surfaces stay damp. Relative humidity also rises as air cools. In WHO's worked example, air at 68 °F and 58% relative humidity reaches 75% when cooled to 59 °F, so a cold window pane or a poorly insulated wall can be damp while the room itself reads fine.
68 to 77 °F
the bedroom range where adults 65 and over slept most efficiently, across 10,903 nights in their own homes.
Baniassadi et al., Science of the Total Environment, 2023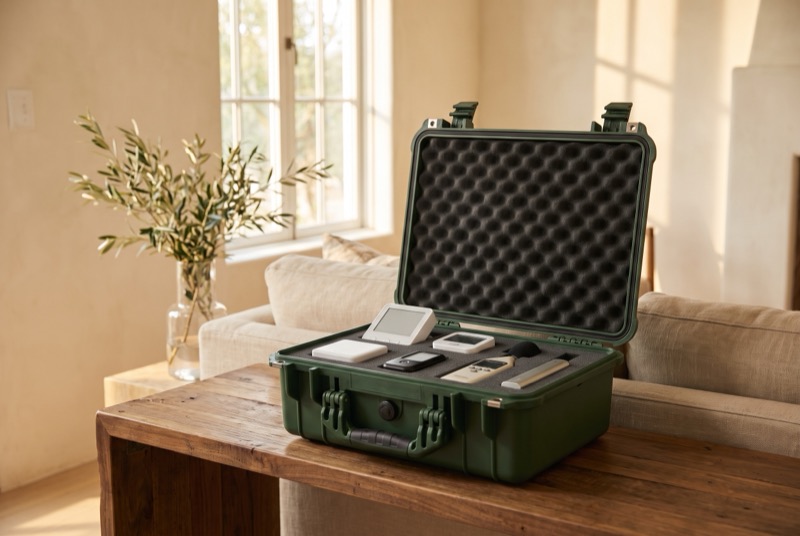
What the research shows
In a study of homes in a humid temperate climate followed across two summers (17 months), 23 homes held below 51% relative humidity, mostly with a dehumidifier plus air conditioning, went from about 400 to about 8 live dust mites per gram of dust. By the end, their mite allergen was more than 10 times lower than in humid homes. Households set their own conditions, and the study measured mites and allergen in dust, not allergy or asthma symptoms.
Arlian et al., Journal of Allergy and Clinical Immunology, 2001Mold responds to the moisture at a surface itself. WHO's review of experiments found that common building and finishing materials generally stay mold-free if the relative humidity right at the surface stays below about 75 to 80 percent. Above that, growth depends on how long the dampness lasts, the temperature and the material.
World Health Organization, indoor air quality guidelines on dampness and mold, 2009Across many observational studies, homes with visible dampness or mold are consistently linked with more asthma and respiratory problems. A 2007 meta-analysis summarized this as roughly 30 to 50 percent higher odds across a range of respiratory and asthma outcomes (the individual summary odds ratios ran from 1.34 to 1.75). These studies looked at visible or reported dampness and mold, not at a humidity number, and they show associations, not proof that dampness or mold caused the problems.
Fisk, Lei-Gomez and Mendell, Indoor Air, 2007
6 more studies
In a Boston-area study of 50 adults aged 65 and over, tracked in their own homes for an average of 212 nights each (10,903 nights in all, with a sleep-tracking ring and bedroom sensors), sleep was most efficient and restful when the bedroom was 20 to 25 °C (68 to 77 °F). Sleep efficiency fell 5 to 10% as nights warmed from 25 to 30 °C (77 to 86 °F), and it also dropped in much colder rooms. This is an association in a relatively high-income group, and people varied a lot.
Baniassadi et al., Science of the Total Environment, 2023In a study of 44 Boston-area university students (average age 20) during a July 2016 heat wave, students in buildings without air conditioning (average indoor 26.3 °C, about 79 °F) had reaction times about 13% slower on two short thinking tests taken right after waking, compared with students in air-conditioned buildings (average 21.4 °C, about 70.5 °F). This was an observational study of young, healthy adults, and it cannot say whether the effect lasted through the day.
Cedeño Laurent et al., PLOS Medicine, 2018In the studies WHO reviewed for its housing guidelines, colder homes were consistently associated with higher blood pressure: all six studies found this, including two randomized trials in Japan. WHO rated its confidence that warming a cold home lowers cardiovascular and respiratory risk as moderate, and says the evidence cannot yet pin down the exact temperature below which harm begins.
World Health Organization, Housing and Health Guidelines, 2018Very dry air has its own downsides. A widely cited 1986 literature review concluded that most humidity-related health effects would be kept lowest between 40 and 60 percent relative humidity. The authors describe their summary chart as suggestive rather than based on measured data, and the chart itself notes too little data on respiratory infections above 50 percent.
Arundel et al., Environmental Health Perspectives, 1986In a CDC/NIOSH lab simulation with coughing mannequins, influenza virus kept about 71 to 77 percent of its infectivity over an hour at 23 percent relative humidity or lower, versus about 15 to 22 percent at 43 percent or higher. No people were involved.
Noti et al., PLOS ONE, 2013The trial evidence is thinner. A Cochrane review found only two small trials of home ventilation and dehumidification systems for people with asthma and dust mite allergy. In the larger, low-bias trial (120 adults), there was no difference in morning peak flow, quality of life, rescue medication, steroid courses, or doctor, ER or hospital visits. Only evening peak flow improved, and mite counts did not differ either.
Singh and Jaiswal, Cochrane Database of Systematic Reviews, 2013
The benchmark
For humidity, your report uses EPA's mold and moisture guidance: if possible, keep indoor relative humidity below 60 percent, ideally between 30 and 50 percent. EPA gives this to prevent mold and moisture problems, and adds that if you humidify, you should not go above 50 percent. For temperature, WHO's 2018 housing guidelines propose 18 °C (about 64 °F) as a safe, well-balanced indoor temperature in cold seasons for temperate and colder climates, and say older adults, young children and people with chronic illness may need it warmer. WHO does not set a bedroom temperature for sleep. For that, see the study of older adults above, who slept most efficiently between 68 and 77 °F.
What your case records
The Aranet4 in every case also logs temperature and relative humidity every ten minutes. Its maker states accuracy of plus or minus 0.3 °C (0.5 °F) and 3 points of relative humidity. Your report shows each room's median and range, and the hours each room spent above EPA's 60 percent line.
What you can do
Public-health guidance groups the fixes into a few familiar kinds: stop moisture at the source (vent clothes dryers and stoves outside where possible, and run bath and kitchen exhaust fans); dry leaks and spills within 24 to 48 hours; use air conditioning or a dehumidifier when needed; warm cold surfaces with insulation; and keep rooms warm enough in winter and cool enough in summer with insulation, heating, shading, night ventilation and fans. If you humidify in winter, EPA says stay at or below 50 percent, empty and refill tanks daily, clean portable units every third day and use low-mineral water such as distilled, because ultrasonic and impeller (cool mist) units can spread microorganisms and minerals from their tanks. The kinds of work are a licensed plumber for leaks, a licensed HVAC contractor for air conditioning and dehumidification, and an insulation contractor for cold walls and attics. These are general guidance, not treatments shown to improve anyone's health.
Where our instruments stop
Our sensor measures the air where it sits. It cannot see moisture inside walls, on cold surfaces or in crawl spaces, it does not test for mold, a reading within about 3 points of 60 percent is within its stated error, and one week reflects that week's weather and season, not the whole year.
Measure yours
Five measures in your rooms for a week, and your tap water at an independent lab.
$1,650 for the whole home plus two rooms, with a written report that sets every reading beside its benchmark.
No card needed, and nothing is charged.
Charged when you order. Ships within up to 8 weeks. Not a subscription.
Light
When your rooms are bright, and when they finally go dark.
The light that reaches your eyes helps set your body clock, which times when you feel sleepy and when you feel alert. Light-sensing cells in the eye carry that signal, including a special type that contains melanopsin and responds most to shorter, bluish wavelengths. For healthy adults aged 18 to 55 on regular daytime schedules, an international group of sleep, circadian and lighting scientists recommends bright days, evenings with little of the light the body clock responds to for the three hours before bed, and a bedroom as dark as possible while you sleep.
90 minutes
shorter melatonin night after eight hours of ordinary room light before bed, compared with dim light, in 116 young adults.
Gooley et al., Journal of Clinical Endocrinology and Metabolism, 2011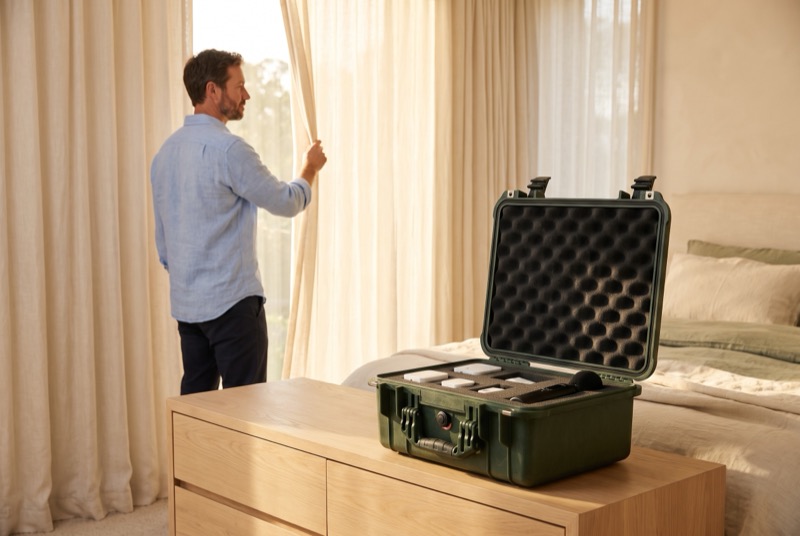
What the research shows
In a lab study of 55 healthy young adults (aged 18 to 30), evening light of about 25 lux, close to typical home evening lighting, was enough to cut melatonin by half on average. The level needed to do that ranged from about 6 lux in the most sensitive person to about 350 lux in the least sensitive, so the same evening lighting can register very differently from one person to the next.
Phillips et al., PNAS, 2019In 59 Melbourne homes measured in autumn and winter with a wearable light sensor, about half (48%) had enough light in the 3 hours before bed to be predicted, on average across people's differing sensitivity, to cut melatonin by at least half. Evenings lit mainly by LED or fluorescent light had nearly twice the body-clock-relevant light of evenings lit by incandescent bulbs, although some homes using warm or dimmable LEDs matched incandescent levels. Melatonin was predicted from lab data, not measured in the homes. Put the other way, about half of the evenings measured already met the consensus evening target (Brown et al., 2022, describing this study).
Cain et al., Scientific Reports, 2020In a small randomized lab study of 20 healthy adults in their 20s, sleeping one night with overhead room light (100 lux) was followed by a higher nighttime heart rate and a rise in a measure of insulin resistance the next morning, compared with sleeping in near-darkness (under 3 lux). It was one night in young, healthy people, and it does not show long-term health effects.
Mason et al., PNAS, 2022
5 more studies
In a lab analysis of 116 healthy adults aged 18 to 30, spending the 8 hours before bed in ordinary room light (under 200 lux) instead of dim light (under 3 lux) made the nightly melatonin rise start later in 99% of people and shortened the melatonin night by about 90 minutes. The study measured melatonin, not sleep or health.
Gooley et al., Journal of Clinical Endocrinology and Metabolism, 2011In a study of 552 older adults (ages 63 to 84) in the Chicago area who wore a wrist light sensor for a week, the 54% who had any measurable light during their darkest five hours were more likely to have obesity, diabetes and high blood pressure. The study captured one point in time, so it cannot show which came first; health problems such as nighttime bathroom trips could themselves lead to more light at night.
Kim et al., Sleep, 2023In about 89,000 UK adults (average age 62) who wore a wrist light sensor for one week, people in the brightest 10% for nighttime light had about a 21% higher risk of dying over roughly eight years than the half of people with the darkest nights. People in the brightest 10% for daytime light had about a 17% lower risk than the half of people with the darkest days. These figures come from the models adjusted for the most social and lifestyle factors. This is a link, not proof that light was the cause.
Windred et al., PNAS, 2024In a study of 109 US federal office workers who wore a light meter for a week, those who got high levels of body-clock-relevant light in the morning reported falling asleep faster (especially in winter) and sleeping better than those who got low levels. It was an observational study in offices, and sleep was self-reported.
Figueiro et al., Sleep Health, 2017Reviews of mostly small lab studies find that brighter or bluer-white daytime electric light tends to make people feel more alert, but the effect depends on the time of day and how much sleep pressure a person has. Effects on complex thinking are inconsistent.
Siraji et al., Frontiers in Psychology, 2022
The benchmark
Recommendations from 18 sleep, circadian and lighting scientists (Brown et al., 2022) give three targets for light reaching the eyes of healthy adults aged 18 to 55 with regular daytime schedules: at least 250 lux melanopic EDI during the day, no more than 10 lux melanopic EDI starting at least 3 hours before bed, and a bedroom as dark as possible (no more than 1 lux melanopic EDI) during sleep. Melanopic EDI is the measure the International Commission on Illumination (CIE) defines for these non-visual effects of light, taken at the eye. CIE's 2024 position statement summarizes these recommendations for healthy young adults and notes that questions remain before they can be fully built into general lighting recommendations. Children, older adults and shift workers may need different targets.
What your case records
A HOBO light logger sits on the inside of each lid, facing the room, and logs every minute. It reads light the way the eye's daytime vision does, which is well suited to timing, so your report tells you when each room is lit, when the last large drop in light comes each evening, how long measurable light lingers after lights-out, and when first light arrives each morning.
What you can do
During the day, use daylight first. In the evening, use light with less of the bluish, short-wavelength part of the spectrum. The consensus paper notes that many warm white (2,700 to 3,000 K) LEDs already meet its evening target at about 30 lux, a common evening light level in homes. At night, use blackout blinds and orientation lighting where needed, and keep the pattern at the same time each day. One free check works in any house: after lights-out, sit in the bedroom for a minute and look for anything still lit, such as a charger, a screen, a timer or a gap at the edge of a blind. For bigger changes, a window-covering installer can fit blackout shades and a licensed electrician can add dimmers and fixtures.
Where our instruments stop
Our light logger reads light the way the eye's daytime vision does (photopic lux), from a fixed spot in the room rather than at your eyes. It can show when and for how long a room was lit and when light fell below what it can detect, but it cannot measure melanopic light, the measure the published targets use, and it cannot tell warm light from cool light. A reading of zero therefore cannot confirm that a bedroom meets the 1 lux sleep target at the eye.
Night sound
How quiet your bedroom stays through the night.
Your bedroom's sound level matters most while you are asleep. Sounds peaking as low as 33 decibels can trigger brief reactions in a sleeping person, and in two German studies of people sleeping at home near traffic, louder indoor peaks were more likely to wake them or shift them into the lightest stage of sleep. Bedroom noise comes from outside, from traffic, construction and the neighborhood, and from inside the home: the World Health Organization lists ventilation systems, home appliances and neighbors as the main indoor sources, and notes that low-pitched noise, for example from ventilation, can disturb rest and sleep even at low levels.
33 dB
Sounds peaking this low can trigger brief reactions in a sleeping person, such as a faster heartbeat or waking.
Basner et al., The Lancet, 2014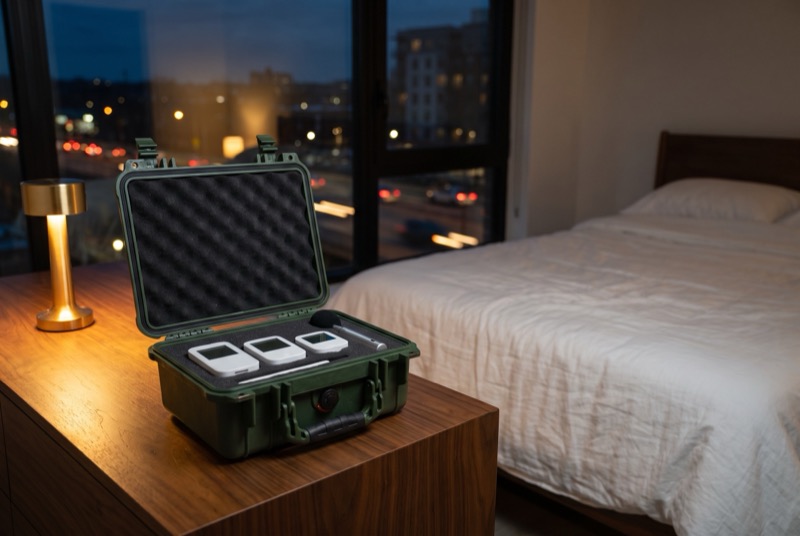
What the research shows
Two German studies recorded brain activity while about 94 people slept in their own homes near traffic. In those studies, each 10-decibel rise in a traffic noise event's peak level indoors raised the odds of waking or shifting into the lightest stage of sleep by about 35 percent. The result was nearly the same for road, rail and aircraft noise. A review done for WHO rated this evidence as moderate quality.
Basner and McGuire, International Journal of Environmental Research and Public Health, 2018In a blinded study, 75 healthy adults (average age 26) slept at home while recordings of aircraft noise played, 30 or 60 events a night with peaks around 60 decibels. Sleep quality was worse after noise nights. After 60 events, a standard test of how well blood vessels widen showed a small drop (9.5 percent versus 10.4 percent after quiet nights), and morning adrenaline was higher (34.1 versus 28.3 ng/L). Morning cortisol and markers of inflammation did not change. These were short-term responses after single nights; the study did not show lasting harm or disease.
Schmidt et al., European Heart Journal, 2013In measurements in 102 Swiss homes near roads, the median drop in sound level from outdoors to indoors was 28 decibels with windows closed, 16 with windows tilted and 10 with windows open.
Locher et al., International Journal of Environmental Research and Public Health, 2018
4 more studies
A 2014 review in The Lancet reports that sounds peaking as low as 33 decibels can trigger brief reactions during sleep, such as a faster heartbeat, body movement or waking. Repeated reactions can fragment sleep, and short-term effects include worse mood, more daytime sleepiness and poorer test performance. The authors note these sleep changes are not unique to noise and are generally milder than in sleep apnea. In lab studies, next-day reaction times slowed by only a few thousandths of a second.
Basner et al., The Lancet, 2014In a sleep lab study of 24 healthy adults aged 19 to 28, traffic noise that woke sleepers raised heart rate by about 30 beats per minute at its peak, about twice the rise seen at the same moments on quiet nights. When sleepers stayed asleep, the peak rise was no bigger than normal swings on quiet nights. The study did not test whether these responses lead to heart disease.
Griefahn et al., Sleep, 2008A study of 4.41 million Swiss adults followed from 2000 to 2008 linked higher estimated traffic noise outside the home to slightly higher rates of death from heart attack, about 2 to 4 percent per 10 decibels. This is an association based on outdoor noise estimates, not proof that noise caused the deaths.
Héritier et al., European Journal of Epidemiology, 2017Playing steady background noise to cover disruptive sounds is common, but a 2021 systematic review of 38 studies rated the evidence that it improves sleep as very low quality. Results ranged from better to worse sleep, and the authors cautioned that continuous noise may also harm sleep and hearing.
Riedy et al., Sleep Medicine Reviews, 2021
The benchmark
For bedrooms, the World Health Organization's guideline (1999) is a nighttime average of no more than 30 decibels (A-weighted, over 8 hours) for continuous noise, and no more than 45 decibels for single sound events, measured with a sound meter on its fast setting. WHO set these values at the lowest level linked to sleep disturbance, said even lower levels suit sensitive people and noise with a lot of low-pitched sound, and wrote that good sleep is believed to need peaks above about 45 decibels to happen no more than 10 to 15 times a night. WHO's 2018 noise guidelines say these 1999 indoor bedroom values still apply. In the US, HUD's goal for the housing in its programs is an indoor day-night average of 45 decibels, a 24-hour average in which sounds between 10 p.m. and 7 a.m. count 10 decibels louder, with emphasis on bedrooms. It is a design goal for HUD-assisted housing, met where feasible, not a health limit for private homes.
What your case records
Every case holds a Convergence Instruments NSRT_mk4 sound level meter that records the sound level every second. It logs sound levels only, never audio, so it records how loud a room gets and never what is said in it. Your report gives each bedroom's average across the night, how many moments went above 45 decibels, when they happened and the loudest one.
What you can do
Quiet the source, block the path (windows, frames, seals, doors and vents are usually the weak points), or move the bed to the quieter side of the home. WHO rated the evidence that such changes affect sleep as moderate for facade insulation and road tunnels, and very low for having a quiet side. Tighter sealing can also cut fresh air, so noise and ventilation have to be handled together. If your louder moments come on a steady rhythm, listen at those times for whatever starts or stops, then call the trade that services it; if you find nothing, a general contractor can look at the windows and doors.
Where our instruments stop
Our sound meter's typical noise floor is 30 decibels, the same as WHO's bedroom average, so it can show that a room is at or near that level but cannot show that a room is quieter than that. It under-reads low-pitched hum, and a sound level alone cannot tell you what made the sound.
Tap water
What comes out of your own kitchen tap.
EPA says the most common sources of lead in drinking water are lead pipes, faucets and fixtures, so lead usually gets into water on its way to your tap. In homes with a lead service line, that pipe is typically the biggest source; in homes without one, the most common problem is brass or chrome-plated brass faucets and lead solder. Because plumbing differs from house to house, your utility's report cannot tell you what comes out of your own tap, and EPA says you cannot see, taste or smell dissolved lead. EPA suggests asking your water utility about testing first, and certified laboratories also test drinking water. More than 43 million Americans drink from private wells, and EPA says private well owners are responsible for keeping that water safe. In a USGS study of 2,100 private wells that EPA cites, about one in five had at least one contaminant above a human-health benchmark for drinking water (EPA on private wells).
Zero
EPA's health goal for lead in drinking water. Lead usually gets into water on its way to your tap.
US EPA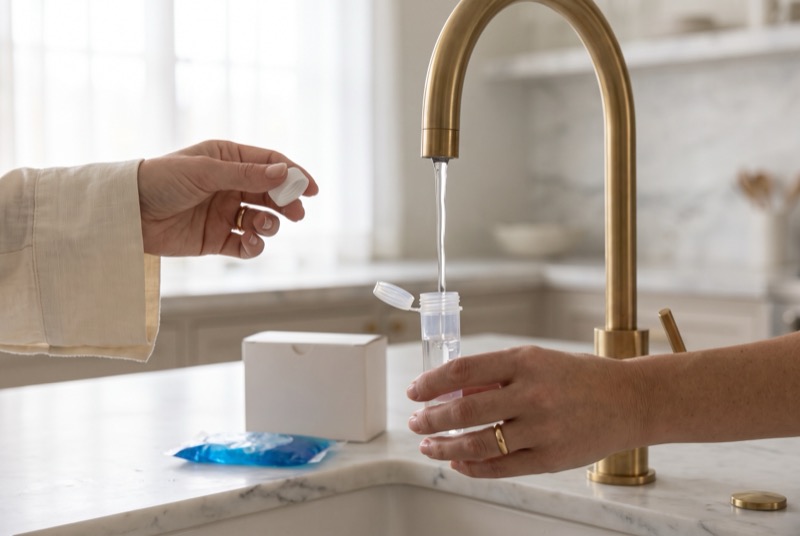
What the research shows
In a pooled study of 1,333 children from seven birth cohorts, followed to ages 5 to 10, higher blood lead went with lower IQ. Each added unit of blood lead was tied to a larger IQ drop at low levels than at high levels: about 3.8 points as blood lead rose from 2.4 to 10 µg/dL, versus 1.1 points from 20 to 30 µg/dL. This was an observational study of lead from all sources, not water alone. Separately, the CDC says no safe blood lead level in children has been identified.
Lanphear et al., Environmental Health Perspectives, 2005 (corrected 2019)Private wells can have lead problems from the home's own plumbing. In Virginia, almost 20% of first-draw samples sent in by private-system homeowners (2,146 samples in all) were above 15 ppb, and the pattern pointed to brass parts as a likely source. These were samples people chose to send in, so this is not a statewide rate. Nearly half the lead in first-draw samples was in particle form on average, which is one reason a single sample can miss or overstate lead.
Pieper et al., Journal of Water and Health, 2015In a 2016 EPA field study at more than 345 homes in Flint, faucet-mounted carbon block filters certified for both lead (NSF/ANSI 53) and fine particles (NSF/ANSI 42, Class I) brought more than 97% of filtered samples below 0.5 µg/L. The study measured water, not health.
Bosscher et al., Journal of Environmental Science and Health, Part A, 2019
5 more studies
After Flint switched to a more corrosive water source without adequate corrosion control, the share of tested children under 5 with blood lead at or above 5 µg/dL rose from 2.4% to 4.9%. In the three wards with the highest water lead, it rose from 4.0% to 10.6%. Outside the city, where the water source did not change, the rise was not statistically significant. The study compared neighborhoods and did not match each child to their own tap. A later analysis of 15,817 Flint blood lead tests from 2006 to 2016 found that the 2014 to 2015 rise happened within a long decline in children's blood lead (Gómez et al., Journal of Pediatrics, 2018).
Hanna-Attisha et al., American Journal of Public Health, 2016Arsenic can get into well water from natural rock, and long-term exposure has been linked to bladder cancer. A study in Maine, New Hampshire and Vermont compared 1,213 people with bladder cancer and 1,418 without. People in the top 2.5% of estimated lifetime arsenic intake from drinking water had about twice the odds of bladder cancer (odds ratio 2.24) of those in the lowest quarter. This is an association from an observational study, and it does not show what risk, if any, exists at or below EPA's 10 ppb limit.
Baris et al., Journal of the National Cancer Institute, 2016EPA's nitrate limit (10 mg/L, measured as nitrogen) was set to protect babies under six months from blue-baby syndrome, and other health effects were not considered when it was set. A 2018 review of more than 30 newer studies found the strongest evidence beyond that for colorectal cancer, thyroid disease and neural tube defects, and many studies saw higher risk below regulatory limits. These are associations, not proof of cause.
Ward et al., International Journal of Environmental Research and Public Health, 2018The nitrate evidence is mixed. A 2022 meta-analysis found no overall link between drinking-water nitrate and colorectal cancer across 10 studies, and found an association with stomach cancer across 4 studies (odds ratio 1.91 per 10 mg/L of nitrate, a different unit from EPA's limit, which is measured as nitrogen). These are associations, not proof of cause.
Picetti et al., Environmental Research, 2022Trihalomethanes form when the disinfectants used to treat tap water react with natural material in the water. A pooled analysis of six case-control studies (2,806 people with bladder cancer, 5,254 without) looked at 40 years of exposure. Men whose long-term average exposure was above 1 µg/L had 24% higher odds of bladder cancer, and those above 50 µg/L had 44% higher odds. No link was seen in women. These are associations, not proof of cause.
Villanueva et al., Epidemiology, 2004
The benchmark
We compare your results with EPA's National Primary Drinking Water Regulations. For most regulated contaminants, EPA sets a health goal (the level below which there is no known or expected risk) and an enforceable limit for public water systems, such as 10 ppb for arsenic, 10 mg/L for nitrate measured as nitrogen, 80 ppb for total trihalomethanes and 4.0 mg/L for fluoride. Lead and copper work differently. EPA's health goal for lead is zero, and 15 ppb is an action level for a whole water system: if more than 10% of the homes a utility samples are above it, the utility must take more steps to control corrosion. In its 2024 rule, EPA says the action level is not a health-based level, and under that rule it drops to 10 ppb on November 1, 2027. Copper's action level is 1.3 mg/L. Some things on the panel, such as manganese, have no federal primary limit, and your report says so.
What your case records
Water is the one measure the cases do not take. An independent laboratory sends you its own drinking-water kit, in a separate box from ours, and your sample goes straight back to the lab on the kit's own prepaid label. The panel covers metals including lead, copper and arsenic; nitrate, nitrite and fluoride; hardness and total dissolved solids; and trihalomethanes and other volatile organic compounds. Homes on a well add a bacteria test, and if you are not sure where your water comes from, you get the well version. The lab's results come back into your report, each set beside EPA's level where one exists.
What you can do
If lead turns up, EPA advises using only cold water for drinking, cooking and baby formula, running the tap before drinking, and using a filter certified to remove lead, and replacing its cartridge as directed, since EPA notes an expired cartridge is less effective at removing lead. EPA's filter guidance points to filters certified under NSF/ANSI 53 to reduce lead to 5 ppb or less and under NSF/ANSI 42 for fine particles (Class I), the same pairing tested in the Flint field study above. Boiling does not remove lead. EPA also says bathing and showering should be safe even if lead is above the action level, because skin does not absorb lead in water. CDC says to learn what is in your water first, so the choice between a filter at one tap and whole-home treatment fits your results, and to check that any system is certified for the specific contaminant you found. For a private well, CDC advises testing at least once a year for total coliform bacteria, nitrates, total dissolved solids and pH, plus anything of local concern. A licensed plumber does this work, and your report names what to ask for.
Where our instruments stop
Our standard water panel does not test for PFAS, radon, pesticides or haloacetic acids, though you can add a PFAS test or a pesticide test when you order. (EPA has set final limits of 4.0 parts per trillion for two PFAS, PFOA and PFOS, in public water. Systems must meet them by 2029, and EPA has proposed letting them request more time, to 2031.) One sample shows one draw from one tap on one day, and lead in particular can come and go, so a single result can miss or overstate what you usually drink.
Not part of the Home Baseline
What we do not measure, and where to start.
Three things that matter in a home are not part of the Home Baseline.
Radon: EPA calls it the second leading cause of lung cancer, says all homes should be tested, and recommends fixing a home at 4 pCi/L or more and considering a fix between 2 and 4 pCi/L (EPA radon, EPA on radon's health risk, EPA's radon action level).
Chemical vapors (VOCs): EPA says many are consistently higher indoors than outdoors, up to ten times higher, and advises more ventilation when using products that release them, buying only what you will use soon, and never mixing household products unless the label says to (EPA on VOCs).
Carbon monoxide: our cases do not measure it and do not replace your alarms. CPSC recommends a carbon monoxide alarm on each level of the home, outside each sleeping area, and a yearly professional inspection of fuel-burning appliances (EPA on carbon monoxide).
Our standard water panel also leaves out PFAS, radon in water, pesticides and haloacetic acids. You can add a PFAS test or a pesticide test when you order; each may come as its own kit from the laboratory. For radon in water or haloacetic acids, ask us and we will tell you what kind of professional does that work.
Sources
Every study and guideline on this page.
- ASHRAE, Position Document on Indoor Carbon Dioxide (2025)
- NOAA Global Monitoring Laboratory, global monthly mean carbon dioxide
- Bekö et al., Ventilation rates in the bedrooms of 500 Danish children, Building and Environment (2010)
- Bennett et al., New Zealand Medical Journal (2026)
- Kang et al., Ventilation causing an average CO2 concentration of 1,000 ppm negatively affects sleep, Building and Environment (2024)
- Fan et al., A single-blind field intervention study of bedroom ventilation and sleep, Science of the Total Environment (2023)
- Strøm-Tejsen et al., Indoor Air (2016)
- Mishra et al., Indoor Air (2018)
- Allen et al., Environmental Health Perspectives (2016)
- Cedeño Laurent et al., PM2.5 and carbon dioxide indoors and cognitive function in office workers (Harvard COGfx), Environmental Research Letters (2021)
Show all 78 sources
- Bornehag et al., Ventilation rates in 390 Swedish homes and allergic symptoms in children, Indoor Air (2005)
- US EPA, Improving Indoor Air Quality
- US EPA, Indoor Particulate Matter
- Klepeis et al., Journal of Exposure Analysis and Environmental Epidemiology (2001)
- World Health Organization, Global Air Quality Guidelines (2021)
- The National Academies, Health Risks of Indoor Exposure to Fine Particulate Matter and Practical Mitigation Solutions (2024)
- Lunderberg et al., Residential PM2.5 and infiltration factors from crowdsourced sensors, PNAS (2023)
- Wang et al., Indoor PM2.5 and sleep-disordered breathing in school-aged children, Sleep Health (2025)
- Lamport et al., Can air purification improve sleep quality?, Journal of Sleep Research (2023)
- Xia et al., Indoor air purification and cardiovascular health, Science of the Total Environment (2021)
- Cheek et al., Portable air purification, Science of the Total Environment (2021)
- Lunden, Delp and Singer, Capture efficiency of cooking particles by residential exhaust hoods, Indoor Air (2015)
- Singer and Delp, Response of consumer and research grade indoor air quality monitors, Indoor Air (2018)
- World Health Organization, indoor air quality guidelines on dampness and mold (2009)
- US EPA, A Brief Guide to Mold, Moisture and Your Home
- US EPA, Use and Care of Home Humidifiers
- World Health Organization, Housing and Health Guidelines (2018)
- Arlian et al., Reducing relative humidity to control dust mites, Journal of Allergy and Clinical Immunology (2001)
- Fisk, Lei-Gomez and Mendell, Meta-analyses of dampness and mold in homes, Indoor Air (2007)
- Baniassadi et al., Nighttime ambient temperature and sleep in older adults, Science of the Total Environment (2023)
- Cedeño Laurent et al., Cognitive function during a heat wave, PLOS Medicine (2018)
- Arundel et al., Indirect health effects of relative humidity indoors, Environmental Health Perspectives (1986)
- Noti et al., High humidity and influenza infectivity, PLOS ONE (2013)
- Singh and Jaiswal, Dehumidifiers for chronic asthma, Cochrane Database of Systematic Reviews (2013)
- CIE, Position Statement on Non-Visual Effects of Light, 2nd edition (2019)
- CIE, Position Statement on Integrative Lighting, 3rd edition (2024)
- Brown et al., Recommendations for daytime, evening and nighttime indoor light exposure, PLOS Biology (2022)
- Gooley et al., Room light before bedtime and melatonin, Journal of Clinical Endocrinology and Metabolism (2011)
- Phillips et al., Sensitivity of the human circadian system to evening light, PNAS (2019)
- Cain et al., Evening home lighting and the circadian system, Scientific Reports (2020)
- Mason et al., Light exposure during sleep and cardiometabolic function, PNAS (2022)
- Kim et al., Light at night in older age, Sleep (2023)
- Windred et al., Personal light exposure and mortality in over 88,000 people, PNAS (2024)
- Figueiro et al., Daytime light, sleep and mood in office workers, Sleep Health (2017)
- Siraji et al., Daytime electric light, alertness and higher cognitive functions, Frontiers in Psychology (2022)
- Onset, HOBO MX2201 and MX2202 logger manual
- World Health Organization, Guidelines for Community Noise (1999)
- WHO Regional Office for Europe, Environmental Noise Guidelines for the European Region (2018)
- US HUD, 24 CFR 51.101, interior noise goal
- Basner and McGuire, Environmental noise and effects on sleep, International Journal of Environmental Research and Public Health (2018)
- Basner et al., Auditory and non-auditory effects of noise on health, The Lancet (2014)
- Griefahn et al., Autonomic arousals related to traffic noise during sleep, Sleep (2008)
- Schmidt et al., Nighttime aircraft noise and endothelial function, European Heart Journal (2013)
- Héritier et al., Transportation noise and cardiovascular mortality in Switzerland, European Journal of Epidemiology (2017)
- Locher et al., Outdoor and indoor sound levels with open, tilted and closed windows, International Journal of Environmental Research and Public Health (2018)
- Riedy et al., Noise as a sleep aid: a systematic review, Sleep Medicine Reviews (2021)
- Convergence Instruments, NSRT_mk4 data sheet
- US EPA, Basic Information about Lead in Drinking Water
- US EPA, National Primary Drinking Water Regulations
- US EPA, Lead and Copper Rule
- Federal Register, Lead and Copper Rule Improvements (October 30, 2024)
- Lanphear et al., Low-level lead exposure and children's intellectual function (corrected 2019), Environmental Health Perspectives
- CDC, About Childhood Lead Poisoning Prevention
- Hanna-Attisha et al., Elevated blood lead levels in children and the Flint water crisis, American Journal of Public Health (2016)
- Pieper et al., Waterborne lead in private drinking water systems in Virginia, Journal of Water and Health (2015)
- US EPA, Private Drinking Water Wells
- CDC, Guidelines for Testing Well Water
- Baris et al., Bladder cancer in northern New England and arsenic in drinking water, Journal of the National Cancer Institute (2016)
- Ward et al., Drinking water nitrate and human health, International Journal of Environmental Research and Public Health (2018)
- Picetti et al., Nitrate in drinking water and cancer risk, Environmental Research (2022)
- Villanueva et al., Disinfection byproducts and bladder cancer, Epidemiology (2004)
- Bosscher et al., Point-of-use filters and lead in Flint, Journal of Environmental Science and Health, Part A (2019)
- CDC, About Choosing Home Water Filters
- US EPA, PFAS National Primary Drinking Water Regulation
- US EPA, Radon
- US EPA, Health Risk of Radon
- US EPA, Volatile Organic Compounds' Impact on Indoor Air Quality
- US EPA, Carbon Monoxide's Impact on Indoor Air Quality
We describe what research found. Where a study found a link rather than a cause, we say so, and we never promise that a test or a fix will change anyone's health. Benchmarks come from organizations such as WHO and EPA, and from published research; Luxewell is not affiliated with or endorsed by any of them.
No card needed, and nothing is charged.
Charged when you order. Ships within up to 8 weeks. Not a subscription.